
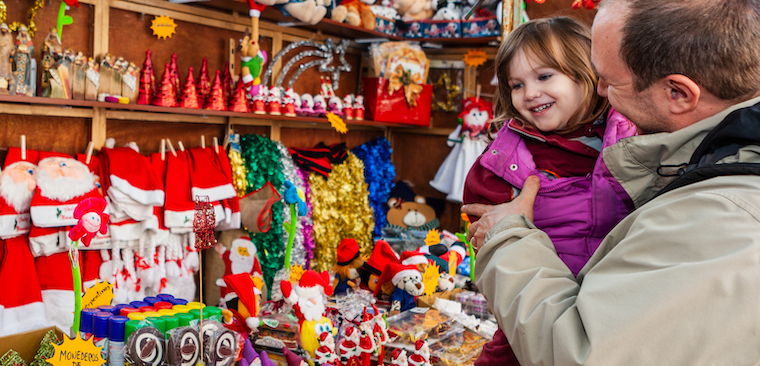
The holiday-shopping and gift-giving season kicked off in earnest during the past five days. To track the annual ups and downs of predicted annual holiday spending, each year the National Retail Federation’s (NRF) and Prosper Insights & Analytics conduct an annual survey of anticipated retail holiday-related spending. This year the survey predicts holiday spending will increase by over 4% when compared to last year (2017 vs. 2018).
Here is a roundup of predictions based on NRF’s annual survey.
“Confidence is near an all-time high, unemployment is the lowest we’ve seen in decades and take-home wages are up,” National Retail Federation President Matthew Shay said when releasing this year’s purchasing survey.
(Note: Tariffs on a wide range of consumer goods from China took effect last month, but Shay noted that retailers imported record volumes of merchandise ahead of the tariffs this summer and said any effect on pricing during the holiday season is expected to be minimal.)
2018 | The big picture
$1,007.24 | The per person average holiday-related amount that will be spent during 2018 season
$967.13 | Comparison: Amount spent in 2018
4.1% | The average increase over last year that consumers said they would spend last year
70% | Percentage of holiday shoppers who plan to make charitable gifts
78% | Of those making contribution, the percentage who say the charitable giving will have no effect on their overall holiday spending
Consumers will spend most in three main categories during the holidays
$637.67 | Gifts
$215.04 | Non-gift holiday items such as food, decorations, flowers and greeting cards
$154.53 | Other non-gift purchases that take advantage of the deals and promotions throughout the season
Holiday shoppers will make purchases across multiple channels and stores
(Can choose multiple retail channels)
55% | Online
55% | In department stores
51% | Discount stores
44% | Grocery stores
33% | Clothing stores
24% | Electronics stores
Holiday shoppers using various forms of delivery
50% | Will shop online and pick up in-store
94% | Will take advantage of free shipping
16% | Will choose expedited shipping
11% | Will choose same-day delivery
When will shoppers purchase gifts?
60% | Shoppers who waited until November to begin browsing and buying items for the season
21% | Started in October
18% | Started in September or earlier
Factors in selecting what retailer to purchase from
71% | Price
60% | Quality and selection of merchandise
47% | Free shipping
45% | Convenient location
Most popular items on people’s wish list
60% | Gift cards
53% | Clothing and accessories
37% | Books/movies/music
29% | Electronics
23% | Home décor
22% | Jewelry
19% | Personal care or beauty items
18% | Sporting goods
17% | Home improvement items
Spending on gift cards continues to rise
$29.9 billion | Amount of gift cards that will be purchased and given as holiday gifts ($27.6 billion in ’17)
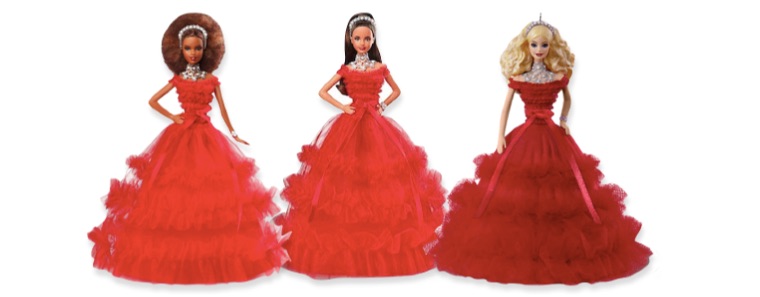
Most popular toys for girls (2018)
- Barbie (Tops the list for the fourth consecutive year)
- L.O.L Surprise doll
- LEGOs
- American Girl
- Hatchimals
- Disney Princess
Most popular toys for boys (2018)
- LEGOs
- Cars and trucks
- Video games
- Hot Wheels
- Marvel action figures/toys
- Paw Patrol
- Nerf
- Gaming systems (Nintendo Switch, PlayStation and Xbox)
Holiday Payment Methods
Consumer payment methods for purchasing holiday gifts remain consistent with 2017.
42% | Percentage of shoppers using credit cards percent of shoppers.
39% | Debit cards
17% | Cash
2% | Checks
Emerging payment methods
35% | PayPal
8% | Apple Pay
5% | Samsung Pay
5% | Google Wallet 5%
4% | Venmo
GettyImages