
Note: This article was first released in January 2018, from data provided by the Bureau of Labor Statistics (BLS). The current data was released in January 2020. Scroll to the bottom of this page for the 2020 data.
In the U.S., the first Monday of September is Labor Day (this year, September 7, 2018). It is recognized as a federal holiday and most government offices and private businesses are closed. Beginning in the late 19th century, as the trade union and labor movements grew in the U.S., trade unions proposed that a day be set aside to recognize and celebrate labor. By the time it became an official federal holiday in 1894, thirty states had already set aside a Labor Day. Below are some statistics about membership in U.S. labor unions that were released in January 2018, by the Bureau of Labor Statistics (BLS).
Union membership (1983 vs. 2017)
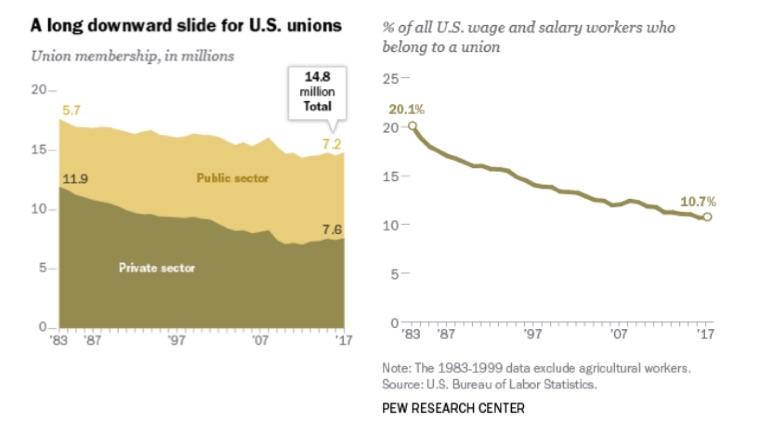
Since 1983, the year the BLS began maintaining union membership statistics, the number of workers in unions has dropped from 20.1 percent of all workers to 10.7 percent and from 17.6 million employees to 14.8 million. Mirroring the overall growth in U.S. employment in 2017, membership in unions edged up by 262,000 in 2017.
Glossary | “Public sector” employees are those who work for federal, state and local governments and their agencies and entities. “Private sector” employees are those who work for private businesses and non-profit organizations that are not run by a government entity.
1983 | 17.6 million (20.1%) | Number (percentage) of all workers (private and public, combined), who belonged to a union in 1983, the first-year data was available.
2017 | 14.8 million (10.7%) | Number (percentage) of all workers (private and public, combined), who belong to a union (as of December 2017).
Union membership today
7.2 million (34.4%) | Number (percentage) of public sector workers who belong to a union
7.6 million (6.5%) | Number (percentage) of private sector workers who belong to a union
Median weekly earnings
$829 | Non-union members
$1,041 | Union members
States with the highest and lowest rates of union membership
23.8% | New York State
2.6% | South Carolina
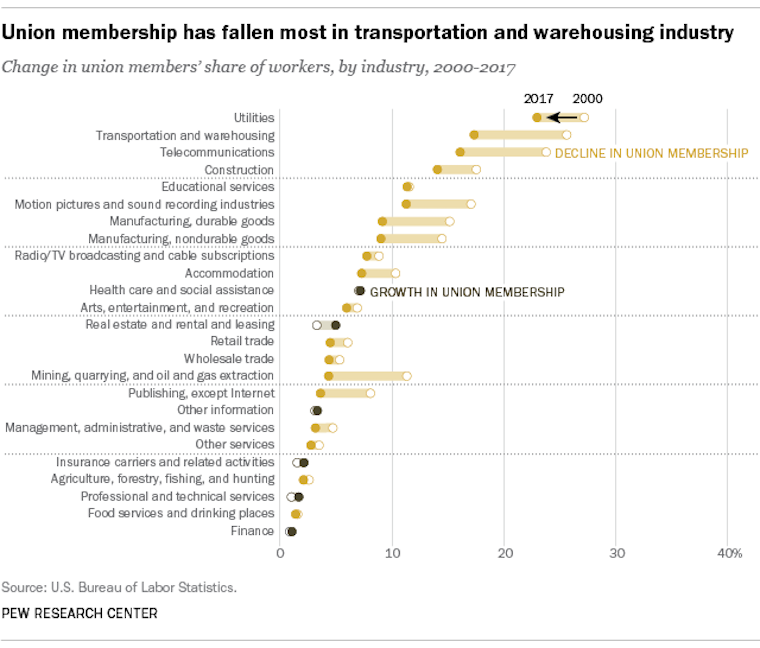
Public and private sector workforces with the highest percentages of the unionized workforce
34.7% | Protective service occupations
33.5% | Education, training, and library occupations
Public and private sector workforces with the lowest percentages of the unionized workforce
1.1% | Food services and drinking places
1.4% | Professional and technical services
Selected characteristics of union members
11.4% | Percent of male workers who are union members
10% | Percent of women workers who are union members
12.6% | Percent of African American workers who are union members
10.6% | Percent of white male workers who are union members
9.3% | Percent of Hispanic workers who are union members
8.9% | Percent of Asian American workers who are union members
13.5% | Percent of workers 55 to 64 years old who are union members
13.2% | Percent of workers 45 to 54 years old who are union members
States with the most union members
2.5 million | California
2.0 million | New York
800,000 | Illinois
700,000 | Michigan
700,000 | Pennsylvania
600,000 | New Jersey
600,000 | Ohio
Sources | Bureau of Labor Statistics Pew Research Center
Charts | PewResearch Center
Photo | GettyImages
Union Membership News Release | 2020
January 22, 2020

In 2019, the percent of wage and salary workers who were members of unions--the union membership rate--was 10.3 percent, down by 0.2 percentage point from 2018, the U.S. Bureau of Labor Statistics reported today. The number of wage and salary workers belonging to unions, at 14.6 million in 2019, was little changed from 2018. In 1983, the first year for which comparable union data are available, the union membership rate was 20.1 percent and there were 17.7 million union workers.

The data on union membership are collected as part of the Current Population Survey (CPS), a monthly sample survey of about 60,000 eligible households that obtains information on employment
and unemployment among the nation's civilian noninstitutional population age 16 and over.
Highlights from the 2019 data:

   --The union membership rate of public-sector workers (33.6 percent) continued to be more than five times higher than the rate of private-sector workers (6.2 percent). (See table 3.)

   --The highest unionization rates were among workers in protective service occupations (33.8 percent) and in education, training, and library occupations (33.1 percent). (See table 3.)

   --Men continued to have a higher union membership rate (10.8 percent) than women (9.7 percent). (See table 1.)

   --Black workers remained more likely to be union members than White, Asian, or Hispanic  workers. (See table 1.)

   --Nonunion workers had median weekly earnings that were 81 percent of earnings for workers who were union members ($892 versus $1,095). (The comparisons of earnings in this release are on a broad level and do not control for many factors that can be important in explaining  earnings differences.) (See table 2.)

   --Among states, Hawaii and New York had the highest union membership rates (23.5 percent and 21.0 percent, respectively), while South Carolina and North Carolina had the lowest (2.2  percent and 2.3 percent, respectively). (See table 5.)

Industry and Occupation of Union Members

In 2019, 7.1 million employees in the public sector belonged to a union, compared with 7.5 million workers in the private sector. The union membership rate declined over the year in the  private sector by 0.2 percentage point to 6.2 percent.

The unionization rate for public-sector workers was little changed over the year at 33.6 percent, and remained substantially above that
of the private sector. Within the public sector, the union membership rate was highest in local  government (39.4 percent), which employs many workers in heavily unionized occupations, such as
police officers, firefighters, and teachers. Private-sector industries with high unionization rates included utilities (23.4 percent), transportation and warehousing (16.1 percent), and
telecommunications (14.1 percent). Low unionization rates occurred in finance (1.1 percent),insurance (1.4 percent), professional and technical services (1.4 percent), and food services and
drinking places (1.4 percent). (See table 3.)

Among occupational groups, the highest unionization rates in 2019 were in protective service occupations (33.8 percent) and in education, training, and library occupations (33.1 percent).
Unionization rates were lowest in farming, fishing, and forestry occupations (2.1 percent); salesand related occupations (2.8 percent); and food preparation and serving related occupations (3.5
percent).

Selected Characteristics of Union Members

In 2019, the union membership rate for men declined by 0.3 percentage point to 10.8 percent, andthe rate for women was down by 0.2 point to 9.7 percent. (See table 1.) The gap between their
rates has narrowed considerably since 1983 (the earliest year for which comparable data are available), when rates for men and women were 24.7 percent and 14.6 percent, respectively.

Among major race and ethnicity groups, Black workers continued to have a higher union membershiprate in 2019 (11.2 percent) than workers who were White (10.3 percent), Asian (8.8 percent), or
Hispanic (8.9 percent). However, the union membership rate for Black workers declined by 1.3 percentage points over the year, while the rates for other race and ethnicity groups changed
little.

By age, union membership rates continued to be highest among workers ages 45 to 64. In 2019, 12.6 percent of workers ages 45 to 54 and 12.7 percent of those ages 55 to 64 were union members.

Over the year, the union membership rate for workers ages 45 to 54 was little changed, while the
rate for those ages 55 to 64 declined by 0.6 percentage point.

In 2019, the union membership rate for full-time workers (11.2 percent) was about twice the ratefor part-time workers (5.5 percent).

Union Representation

In 2019, 16.4 million wage and salary workers were represented by a union, little changed from 2018. The percentage of workers represented by a union was 11.6 percent, a slight decrease from
11.7 percent in 2018. Workers represented by a union include both union members (14.6 million) and workers who report no union affiliation but whose jobs are covered by a union contract (1.8
million). (See table 1.)

Earnings

Among full-time wage and salary workers, union members had median usual weekly earnings of $1,095 in 2019, while those who were not union members had median weekly earnings of $892. In addition to coverage by a collective bargaining agreement, these earnings differences reflect a variety of influences, including variations in the distributions of union members and nonunion employees by occupation, industry, age, firm size, or geographic region. (See tables 2 and 4.)

Union Membership by State

In 2019, 28 states and the District of Columbia had union membership rates below that of the U.S. average, 10.3 percent, while 21 states had rates above it and 1 state had the same rate. All
states in both the East South Central and West South Central divisions had union membership rates below the national average, while all states in both the Middle Atlantic and Pacific divisions
had rates above it. (See table 5.)

Eight states had union membership rates below 5.0 percent in 2019. South Carolina and North  Carolina had the lowest rates (2.2 percent and 2.3 percent, respectively). The next lowest rates  were in Texas and Virginia (4.0 percent each). Two states had union membership rates over 20.0  percent in 2019: Hawaii (23.5 percent) and New York (21.0 percent).

Over half of the 14.6 million union members in the U.S. lived in just seven states (California,  2.5 million; New York, 1.7 million; Illinois, 0.8 million; Pennsylvania, 0.7 million; and New
Jersey, Ohio, and Washington, 0.6 million each), though these states accounted for only about  one-third of wage and salary employment nationally.