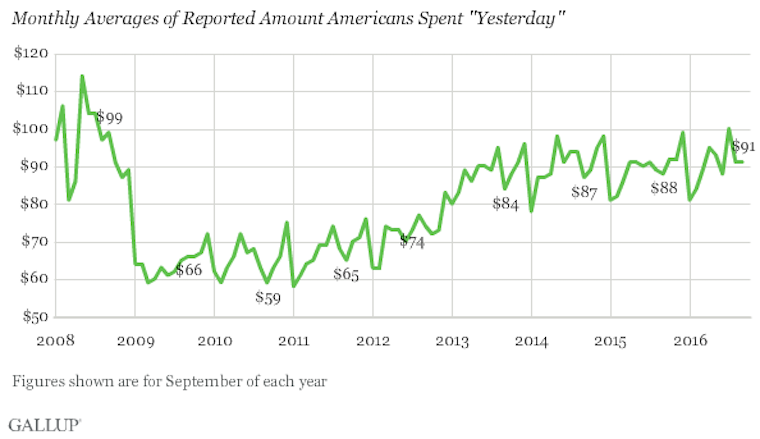
According to Gallup’s daily poll of consumer spending released yesterday (Monday, October 3, 2016), American consumers this year avoided a September slump in spending typically seen in the years since the financial collapse of 2008. Avoiding the September slump has helped keep average spending for the first nine months of 2016 the highest for any year since 2008. Spending patterns of the past decade for the months of October, November and December suggest that spending will increase even further, according to Gallup.
$80 | Americans’ daily spending estimates have consistently averaged $80 or higher in all but one month since 2012.
$58-$77 | From 2008 – 2011, monthly spending averages were as low as $58 and never above $77.

Spending Avoids Usual September Slump
Spending in the U.S. had been lower in September than in August in each of the past six years. This year it held steady. In all but one of those years it subsequently rose in October.
Monthly Consumer Spending Averages, 2008-2016
| August | September | October | |||||||||||||||||||||||||||||||||||||||||||||||||||||||||||||||||||||||||||||||||||||||||||||||||
|---|---|---|---|---|---|---|---|---|---|---|---|---|---|---|---|---|---|---|---|---|---|---|---|---|---|---|---|---|---|---|---|---|---|---|---|---|---|---|---|---|---|---|---|---|---|---|---|---|---|---|---|---|---|---|---|---|---|---|---|---|---|---|---|---|---|---|---|---|---|---|---|---|---|---|---|---|---|---|---|---|---|---|---|---|---|---|---|---|---|---|---|---|---|---|---|---|---|---|---|
| $ | $ | $ | |||||||||||||||||||||||||||||||||||||||||||||||||||||||||||||||||||||||||||||||||||||||||||||||||
| 2008 | 97 | 99 | 91 | ||||||||||||||||||||||||||||||||||||||||||||||||||||||||||||||||||||||||||||||||||||||||||||||||
| 2009 | 65 | 66 | 66 | ||||||||||||||||||||||||||||||||||||||||||||||||||||||||||||||||||||||||||||||||||||||||||||||||
| 2010 | 63 | 59 | 63 | ||||||||||||||||||||||||||||||||||||||||||||||||||||||||||||||||||||||||||||||||||||||||||||||||
| 2011 | 68 | 65 | 70 | ||||||||||||||||||||||||||||||||||||||||||||||||||||||||||||||||||||||||||||||||||||||||||||||||
| 2012 | 77 | 74 | 72 | ||||||||||||||||||||||||||||||||||||||||||||||||||||||||||||||||||||||||||||||||||||||||||||||||
| 2013 | 95 | 84 | 88 | ||||||||||||||||||||||||||||||||||||||||||||||||||||||||||||||||||||||||||||||||||||||||||||||||
| 2014 | 94 | 87 | 89 | ||||||||||||||||||||||||||||||||||||||||||||||||||||||||||||||||||||||||||||||||||||||||||||||||
| 2015 | 89 | 88 | 92 | ||||||||||||||||||||||||||||||||||||||||||||||||||||||||||||||||||||||||||||||||||||||||||||||||
| 2016 | 91 | 91 | |||||||||||||||||||||||||||||||||||||||||||||||||||||||||||||||||||||||||||||||||||||||||||||||||
| Source: Gallup Daily Tracking | |||||||||||||||||||||||||||||||||||||||||||||||||||||||||||||||||||||||||||||||||||||||||||||||||||
On the other hand
Gallup adds a note of caution: “While the relatively high level of September spending could indicate that Americans stayed in a buying mood even after the end of summer vacations and back-to-school shopping, it could also mean that the customary September-to-October rise in spending has already taken place.”
Although presidential elections generally do not affect consumer spending, Americans’ negative views about the two major-party candidates could affect consumer confidence and spending in ways not seen in 2008 or 2012.
Thinkstock
