Halloween spending is expected to reach a near-record amount this year, according to the National Retail Federation’s annual survey conducted by Prosper Insights & Analytics. Total 2019 Halloween spending is expected to be the third-highest spending year in the survey’s 15-year history. According to the survey, 172 million people plan to celebrate Halloween this year (compared to 2018’s 175).
$8.8 billion | 2019
$9.0 billion | 2018
$9.1 billion | 2017
Where are Halloween participants seeking inspiration for Halloween in 2019?
35% | Online research
28% | Browsing in stores
29% | Ideas from friends and family
“Spending hasn’t changed much over the past few years, but we are seeing a noticeable increase in consumers whose Halloween purchases are inspired by their friends, neighbors and even celebrities on social media.”
Matthew Shay
NRF President and CEO
What percentage of survey participants are doing these traditional Halloween activities?
95% | Buying candy
72% | Decorating house or yard
67% | Dressing in costumes
44% | Carving a pumpkin
32% | Attending a party
29% | Taking children trick or treating
22% | Visiting a haunted house
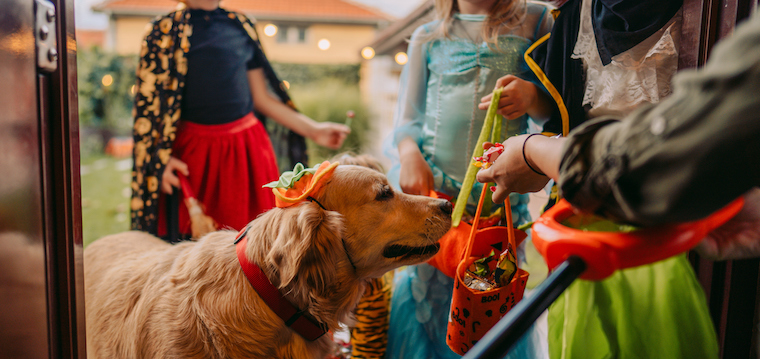
17% | Dressing pets in costume.
Where are celebrants shopping for Halloween merchandise this year (2019)?
42% | Discount store
36% | Specialty Halloween or costume store
25% | Online
25% | Grocery store
23% | Department store
Top Costumes (Children)
“Grownups who celebrate may be looking for new ideas, but for children, princesses and superheroes are perennial favorites,” Prosper Insight’s Phil Rist said. Costumes you’ll be seeing children wear in 2019.
7.9% |Princesses (3.1 million children)
6% | Superhero (2.4 million)
5.2% | Spider-Man (2 million)
3.9% | Avengers character other than Spider-Man (1.5 million)
3.5% | Batman (1.4 Million)
3.3% | Witch
2.8% | Ghost
2.2% | Vampire
2.2% | Frozen (Elsa, Anna
2.1% | Pirate

Top Costumes (Adults)
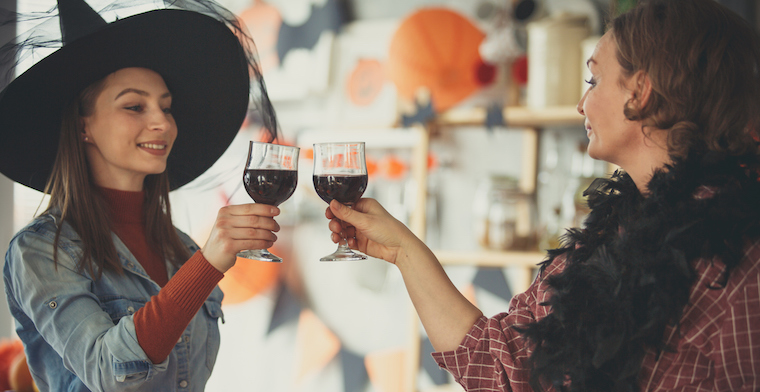
Five million adults plan to dress in a Halloween costume. Here are the most popular. (Ranked by percentage of Halloween participants wearing a costume.)
8.9% | Witch
3.6% | Vampire
3.1% | Superhero
2.7% | Pirate
2.5% | Zombie
2.0% | Ghost
2.0% | Avengers character (excluding Spider-Man)
1.9% | Princess
1.8% | Cat
1.7% | Spider-Man

Top Costumes (Pets)
29 million people plan to dress their pets in costumes for Halloween. Really. Of those who plan to dress there pets, here are the most popular costumes.
9.3% | Pumpkin
7.2% | Hot dog
7.2% | Superhero
3.9% | Bumble Bee
3.2% | Cat
2.5% | Witch
2.2% | Lion
2.1% | Dog
2.0% | Devil
1.7% | Shark
Happy Halloween to the small businesses that make Halloween a fun and prosperous event each year.
